As we approach 2026, the energy is shifting dramatically. We are moving away from the…
BaZi, Sounds and Frequencies
People often ask me how BaZi works, and although I have studied it for almost 15 years, I don’t think I have a single-shot answer. Understanding BaZi is like peeling an onion; new layers keep coming up.
I like approaching BaZi from different angles, and recently I’ve been developing a new one around sounds and frequencies.
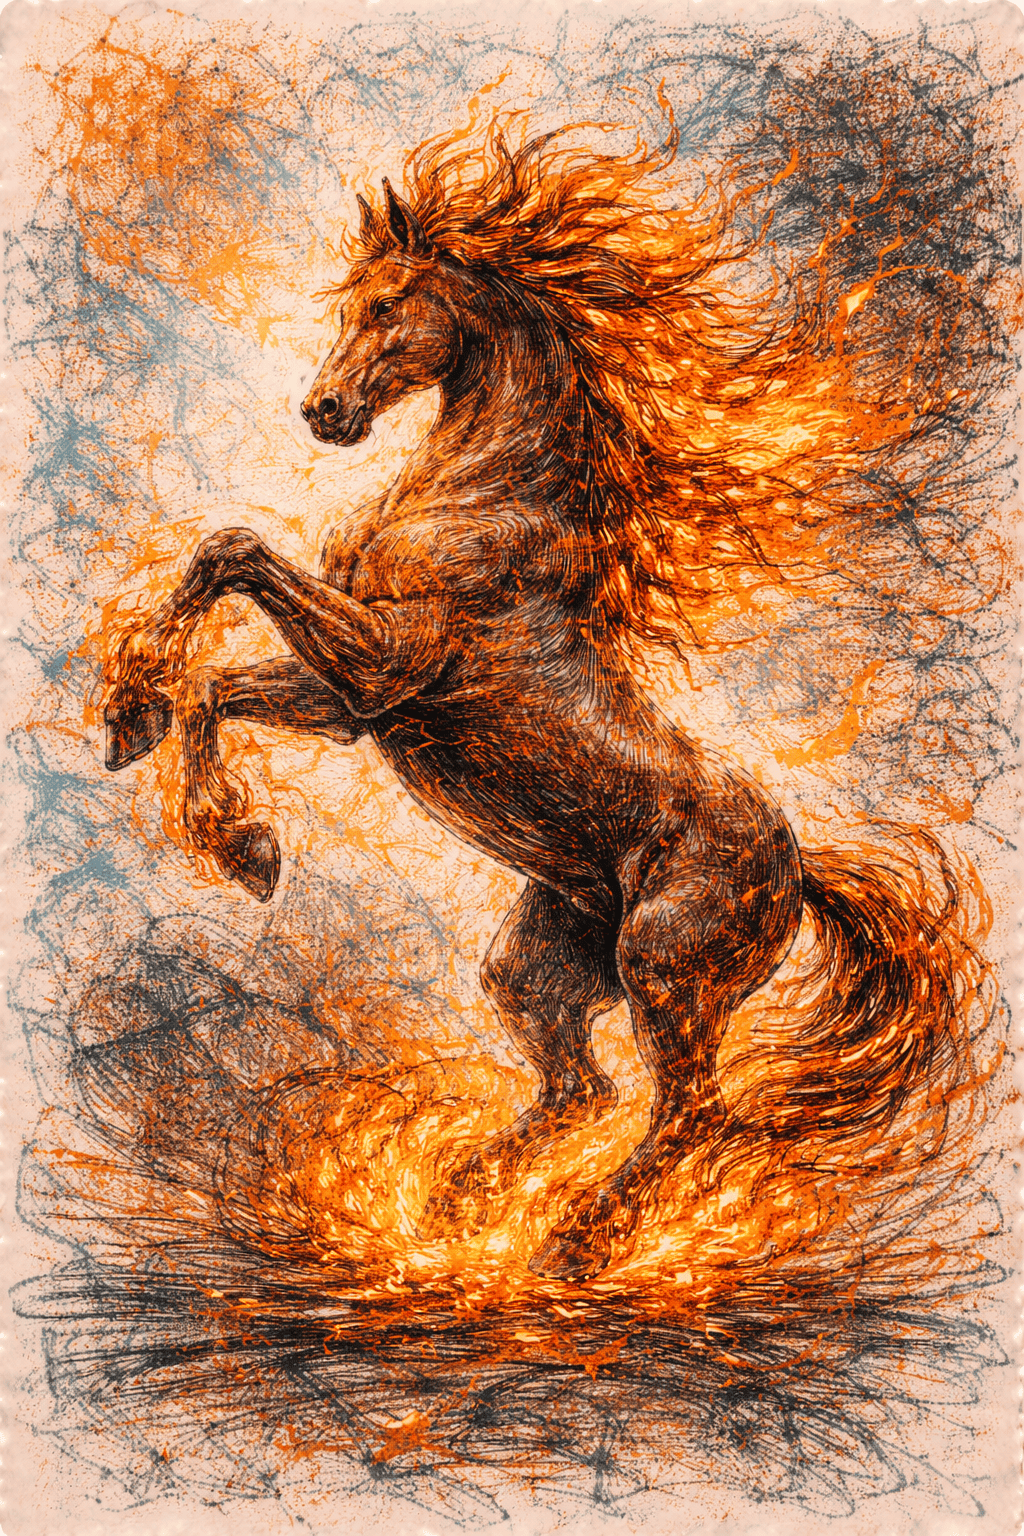
Everything we see in our material world, including our physical bodies, is made out of sounds and frequencies that, at a particular tune, appear to be solid and colorful. Sound can change the physical structure of our material world; therefore, it has healing properties.
Pvrellis – W?w
Art with light and sound
Schematic pic.twitter.com/28BB7GkVpx— Babbsy (@anchoragewaters) July 8, 2023
A healing sound is usually pleasant to our ears, whereas a disturbing sound is not. So, for example, if you play a guitar, if you strike a nice, harmonious chord, it will feel pleasant, and your entire body will react positively to that pleasant frequency. But if you hit a wrong, nonsensical chord, it will feel unpleasant, and people around you will ask you to stop.
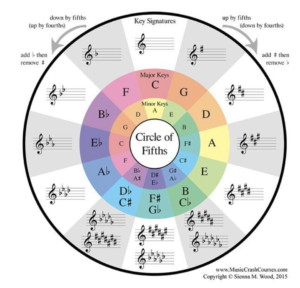 BaZi works similarly. A musical sheet is based on 12 notes, while BaZi (and Western Astrology) is based on 12 Branches; therefore, each note is related to a Branch, representing a frequency. A familiar guitar chord usually has six musical notes, while BaZi Chart has eight symbols, which we can characterize as musical notes because each symbol brings one type of frequency. Those frequencies have to play nicely with each other; otherwise, the Chart ends up having a confusing flow of Elements.
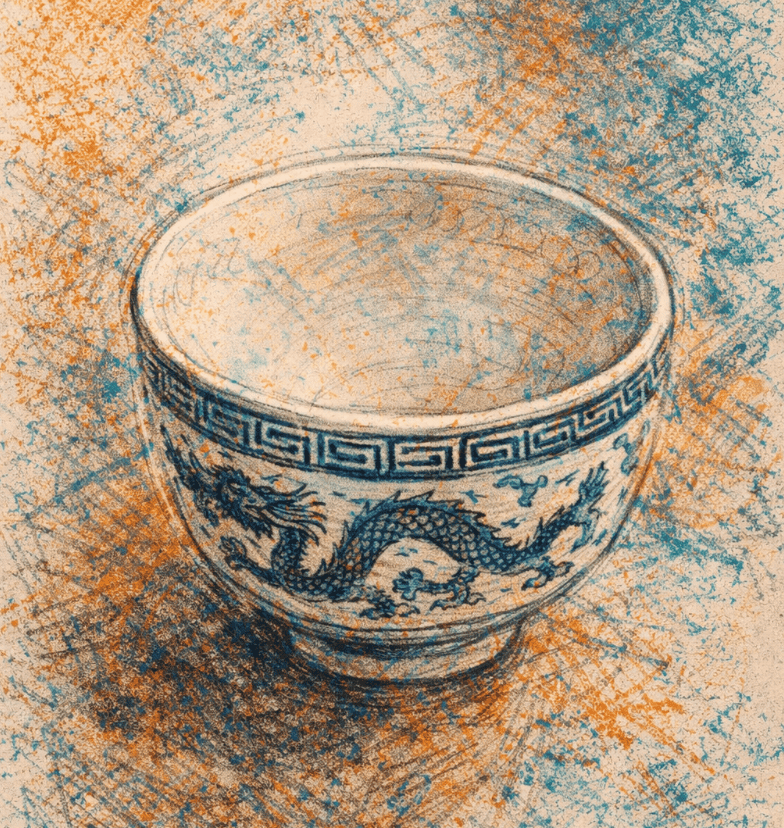
A good Chart will also include clear visuals, which are a form of frequency. A bad Chart will look random and unpleasant to the eye. Of course, one needs some experience to identify good and bad visuals. That’s why the user interface is essential. We have seen many BaZi apps and services with ugly graphics, and it’s tough to recognize the theme; therefore, users struggle to read them.
 We have spent a lot of time on Chart graphics, making sure that those colors and shapes give us an instant idea of what we are dealing with on each Chart, like this cute little Pig that instantly tells you that it carries an Element of Water 🙂
That’s why we have developed features such as Talent Bridge, Qi Balance, and Supertalents to help us identify those themes quickly, and we will continue to do so.
Related Posts